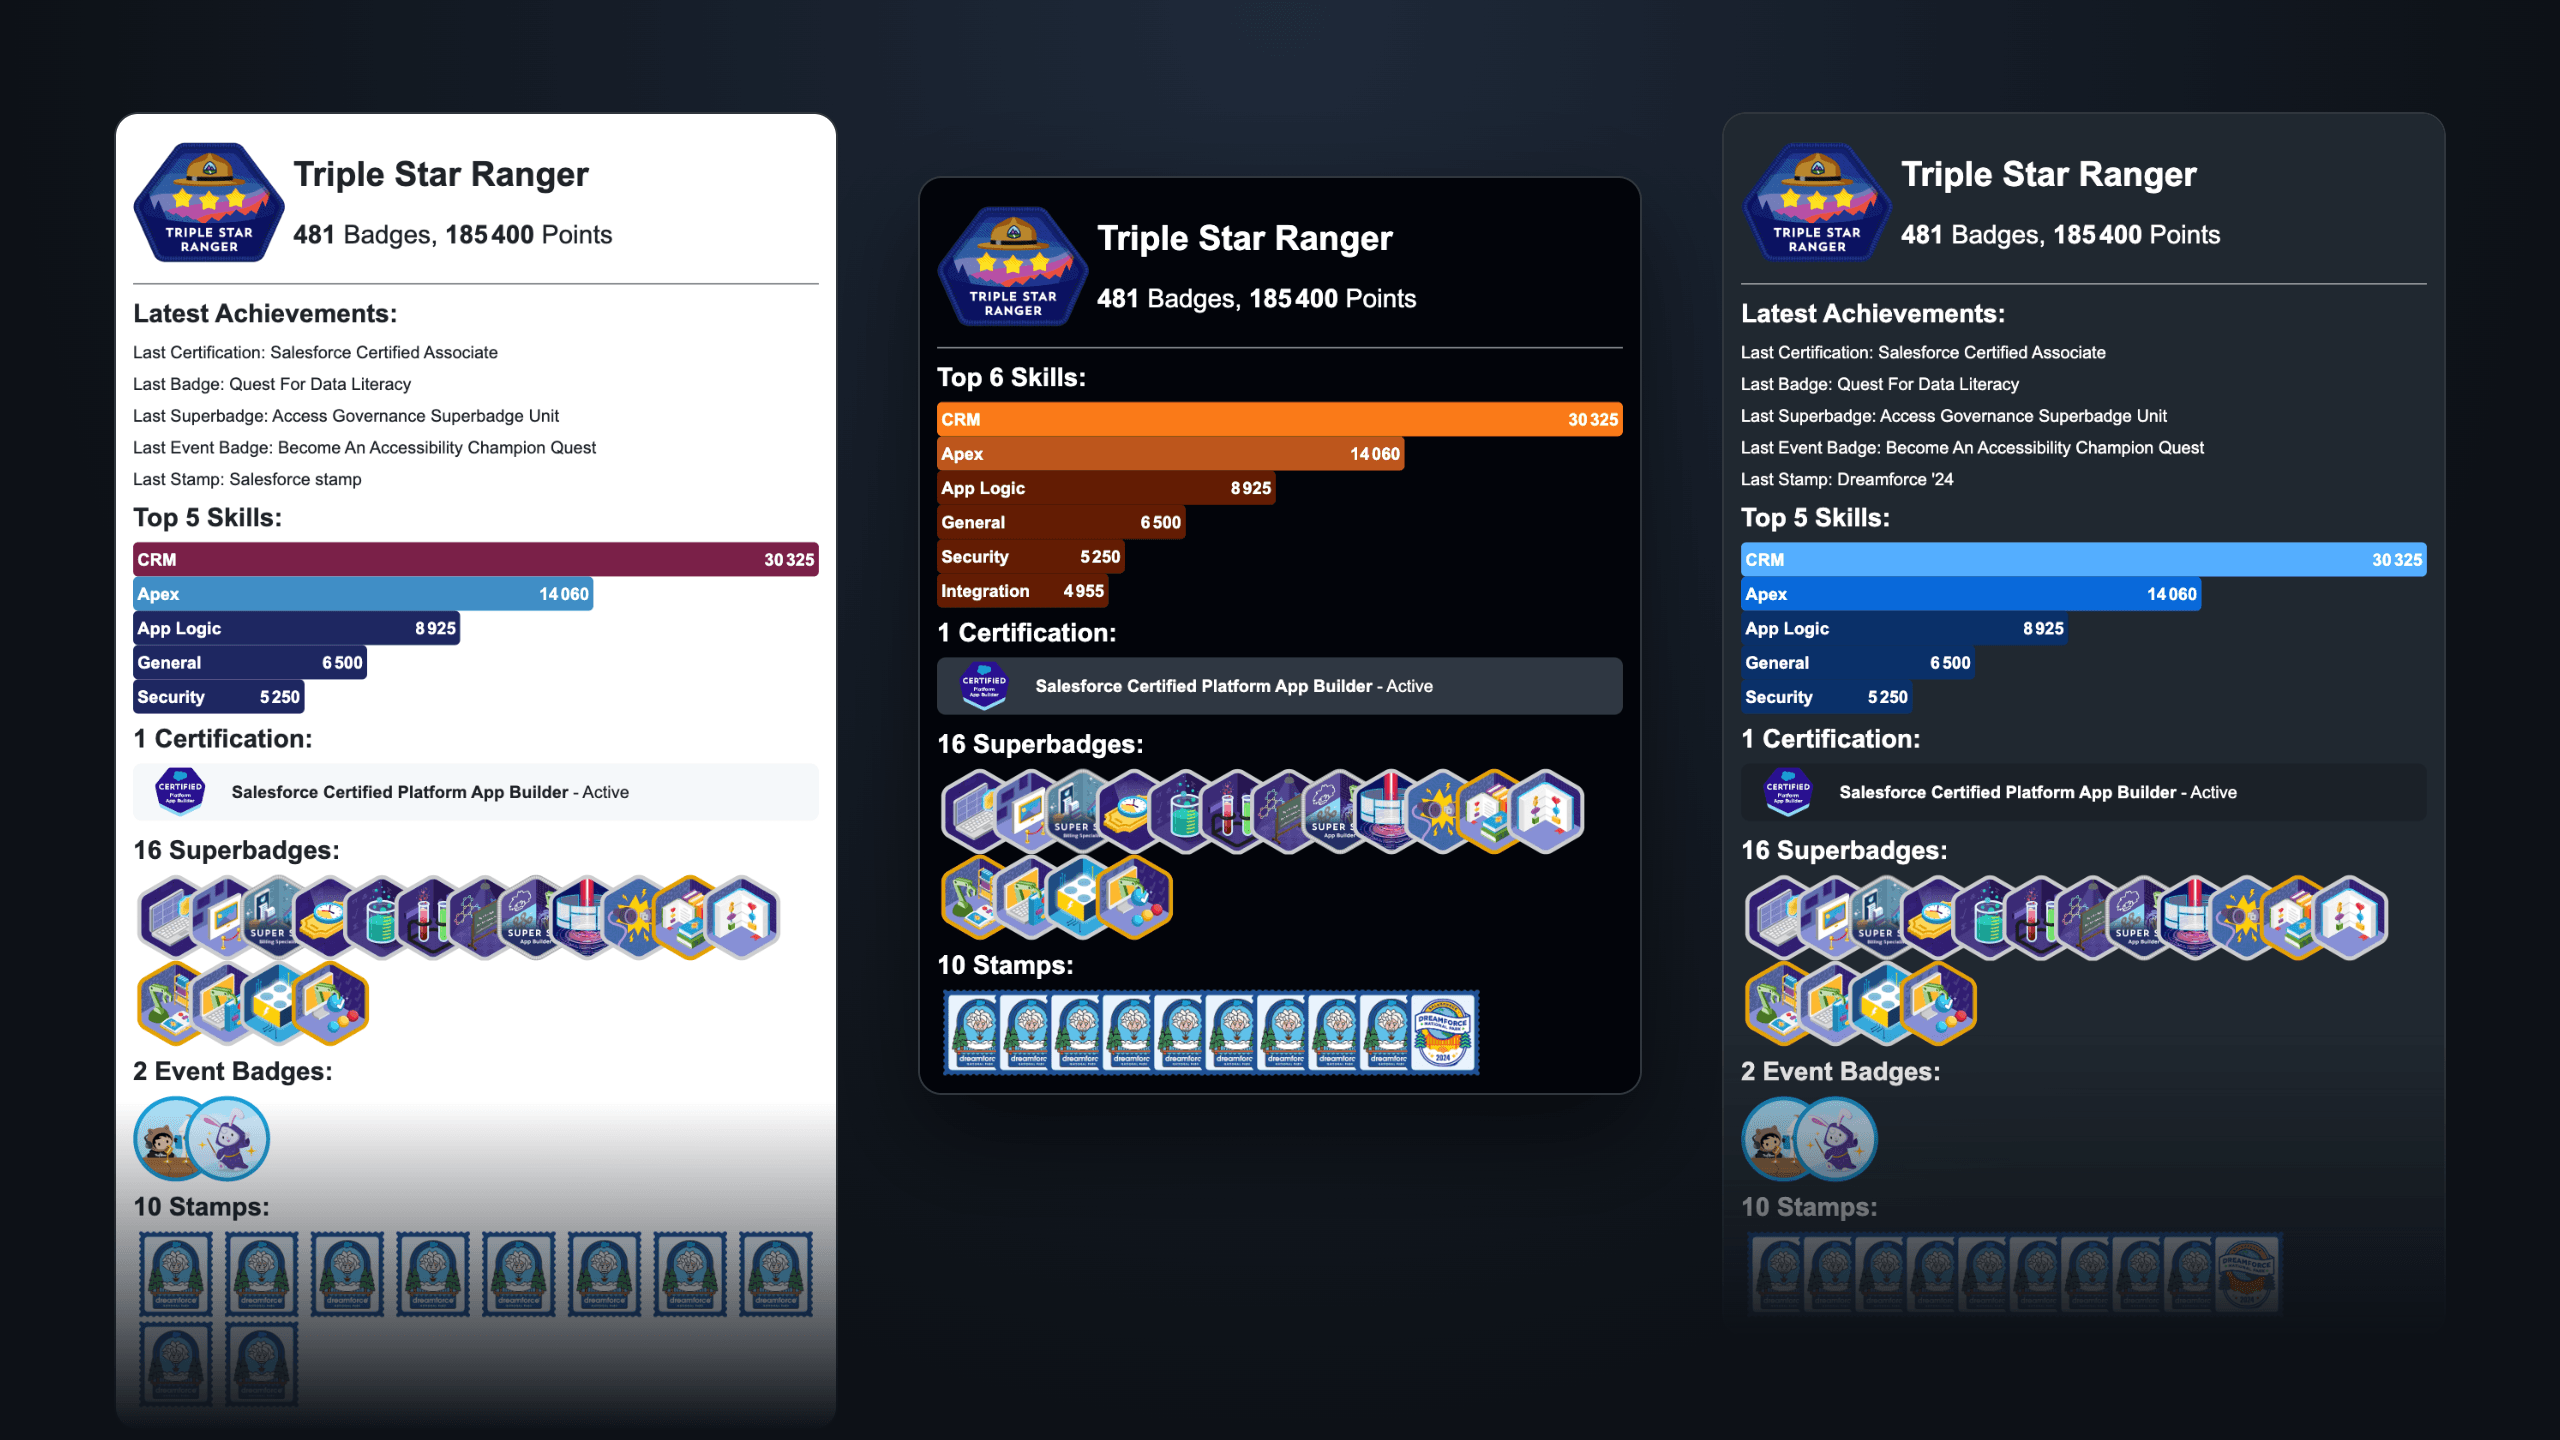
Overview
Key Features
- Live Data Fetch: Fetch live data for Trailhead rank, badges, points, skills, certifications, superbadges, and more.
- Card or Text: Display the stats as an image card, or as a plain list in Markdown or HTML. The data is also available as an output for other workflows.
- Light and Dark: Every card is generated in both themes, and GitHub shows the one matching the visitor's theme, with a choice of GitHub's dark styles.
- Selective Display: Show each section as a number, icons, a table or a detailed list, or hide it, and add the latest achievements.
- Skill Themes: Color the skill bars with a theme, such as Halloween or Olympic, or with your own colors.
- Automatic update: As it is a GitHub Action, it can run every day to always display accurate data, and only commits when something changed.
Technologies Used
- JavaScript and Node.js: For building the GitHub action.
- GraphQL: For querying the Trailhead data.
- Puppeteer: For turning the card, built as an HTML page, into an image.
- Jest: For snapshot tests, while every pull request also runs the action on a real profile.